

Get Tavily API Key
Sign up at tavily.com
Introduction
Langfuse is an open-source LLM engineering platform that helps teams trace, debug, and evaluate their LLM applications. It captures nested traces of LLM calls, tool calls, and agent logic so you can see exactly what happened during a run. When an agent calls Tavily’s Search or Extract APIs, Langfuse’s@observe() decorator wraps those calls as tool spans inside the trace. This gives you visibility into which queries were sent, what Tavily returned, how long each call took, and how that output fed into subsequent LLM calls — all in one trace.
Requirements
- A Langfuse account (Cloud or self-hosted), with a public/secret API key pair
- A Tavily API key
- An OpenAI API key, if you’re following the tool-calling agent example below
Setup
Step 1: Install dependencies
Step 2: Configure environment variables
Step 3: Initialize the Tavily client
Tracing Tavily Search and Extract
Wrap each Tavily call in a function decorated with@observe(as_type="tool"). Langfuse records the function’s arguments and return value as a tool span, nested under whatever trace or agent span called it.
Tracing a tool-calling agent
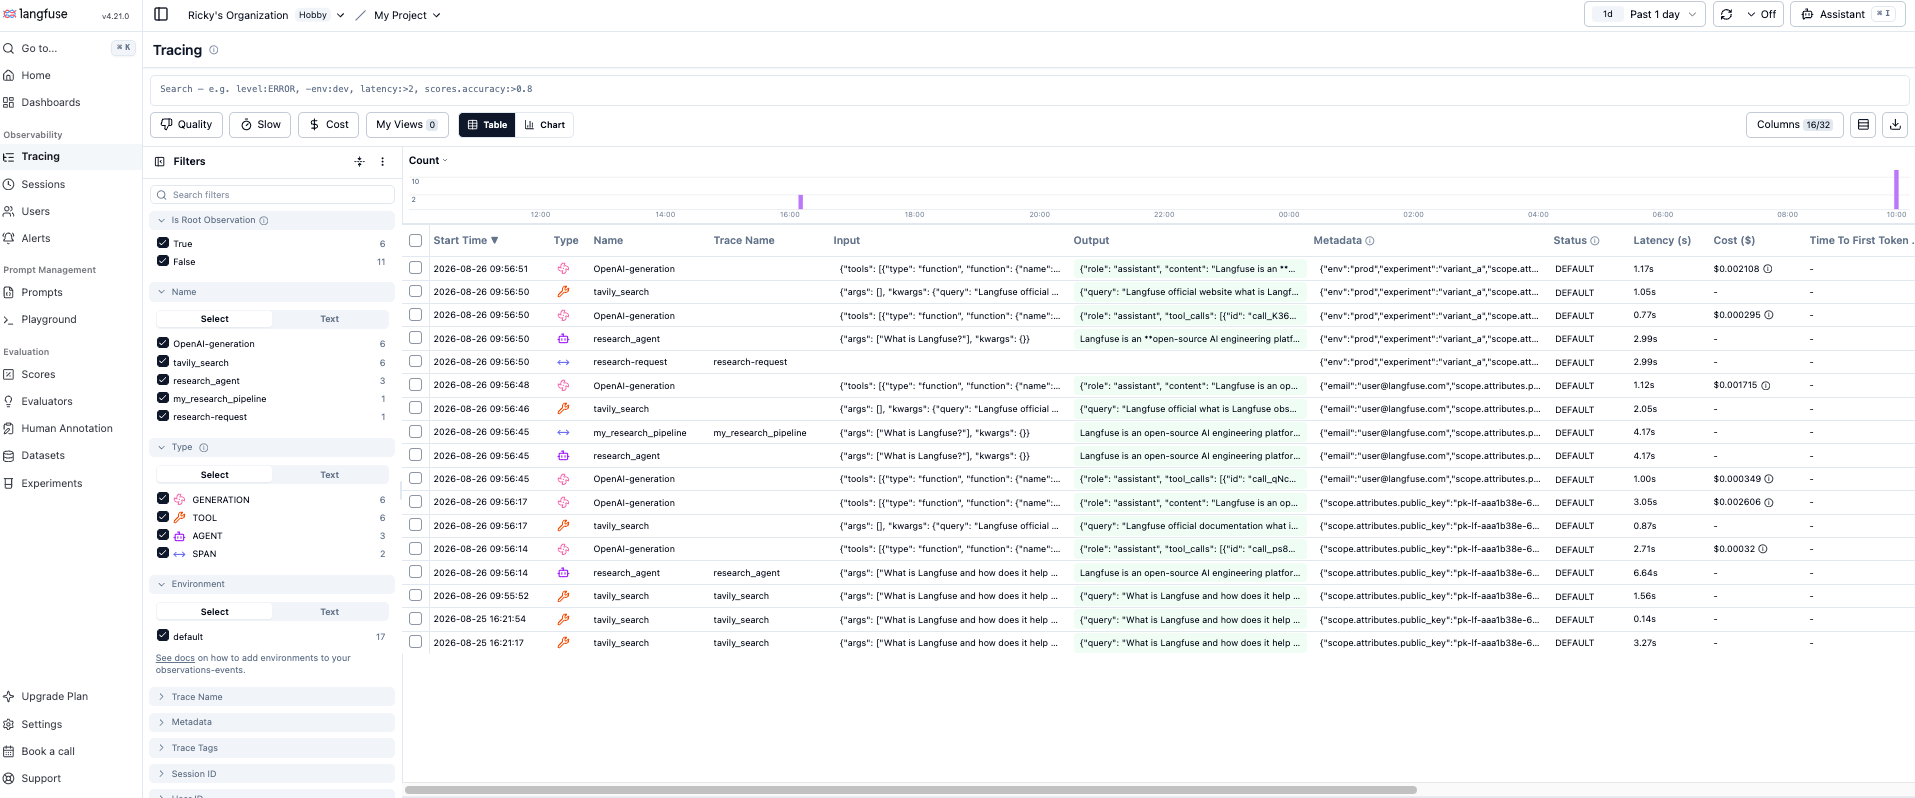
To see Tavily calls in context, wiretavily_search and tavily_extract up as OpenAI tools inside an @observe(as_type="agent") function. Langfuse’s OpenAI wrapper (langfuse.openai) traces each LLM call, and the nested @observe tool functions trace each Tavily call — all under a single agent trace.
tavily_search/tavily_extract invocation as its own tool span with full input/output and latency.
What you get in the trace
- Search and extract queries and the parameters they were called with (
search_depth,max_results,urls,chunks_per_source,format) - Response times for each Tavily API call, alongside LLM call latency in the same trace
- Nested structure showing exactly when in the agent’s reasoning loop each tool call happened
- Full input/output for every call, so you can debug why an agent picked a query or how it used extracted content
Adding user, session, and metadata attributes
Usepropagate_attributes to attach user_id, session_id, tags, metadata, or version to every observation created inside a block — including your Tavily tool spans and any LLM calls.
start_as_current_observation, including pinning it to a known trace ID:
Troubleshooting
No observations appearing in Langfuse
No observations appearing in Langfuse
Set
export LANGFUSE_DEBUG="True" and check your logs for OpenTelemetry spans being exported. Confirm you’re calling langfuse.flush() before your process exits — otherwise buffered observations may never be sent. Also verify LANGFUSE_PUBLIC_KEY, LANGFUSE_SECRET_KEY, and LANGFUSE_BASE_URL are correct for your region with langfuse.auth_check().Unexpected extra spans in a trace
Unexpected extra spans in a trace
The Langfuse SDK is built on OpenTelemetry, which can capture spans you didn’t explicitly instrument. Filter these out if they’re consuming billable observability units you don’t need.
Missing or unmapped attributes
Missing or unmapped attributes
Some data may land in an observation’s
metadata rather than a dedicated field in the Langfuse data model. If something looks wrong, check the raw observation payload before assuming the call failed.